HOME SCIENTIFIC BACKGROUND MATHEMATICAL BACKGROUND EEG MODEL ANALYSIS FUTURE ITERATIONS AUTHORS ACKNOWLEDGMENTS

EEG MODEL

Common EEG Waveforms

Within EEG signals, there are 10 common waveforms you can expect to see. Three of these waveforms correspond with epileptic seizures. As indicated in the following image, the three main waves present in the signal are sharp waves, spike waves, and spike-and-wave. These, common in seizure, waveforms are boxed in blue. Common waveforms for normal brain activity are boxed in red.

Types of EEG Waves

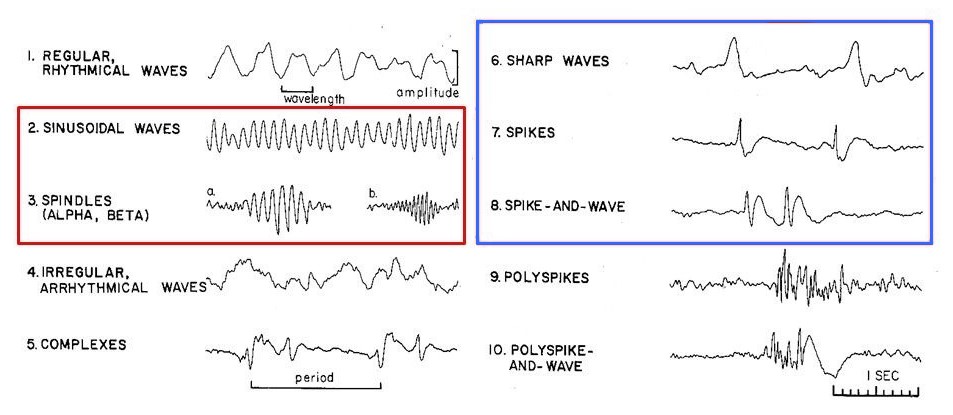
This image is a modified version of one shown in a presentation by Dr. Valja Kellerovà. It can be found on slide 7 at the following link: Image Source.

Common EEG Frequencies

Normal brainwave frequencies can be classeified as:

  1. Delta - frequency < 3 Hz, typically exist during a deep sleep

  2. Theta - 3.5 Hz > frequency < 7.5 Hz, less deep sleep and uncommon for adults who are awake

  3. Alpha - 7.5 Hz > frequency < 13 Hz, normal brain activity for an awake adult

  4. Beta - 14 Hz > frequency, typically found in adults who are anxious or alert

RC Circuit Model of a Neuron

Additionally, we can model a single neuron with resistors and capacitors. What this will model is an action potential curve. Since we know that the EEG signal is a combination of many action potentials, we could create a network with these RC circuits in them to model several neurons and the resulting signal. The following image shows the circuit schematic that we used to model a passive dendrite to observe the properties of a neuronal process.

RC Modeling Circuit

The following image is a picture of the original circuit that we used for modeling:

RC Modeling Circuit

We captured some frames of the neuronal model output and obtained the following graphs. We were able to draw some similarities between the sample action potential and the circuit results. The stimulus (produced by Na+ ions in a nueron) and the resting state (produced by K+ ions in a neuron) are clearly visible.


To test the circuit, we used a Tektronix AFG 3022B Dual Channel Function Generator to generate an input square wave of a 4Hz frequency and 5V of amplitude. We also used a Rigol DS2202 Digital Oscilloscope to measure the output of the wave passes. The screenshots that we present below are from the Oscilloscope.

RC Modeling Circuit

We can also observe the depolarization, repolarization, and the hyperpolarization phases for multiple action potential passes.

RC Modeling Circuit

Quoting the paper by Caltech, "As an aside, studies have shown that the dendrites of many types of neurons contain active ion channels (i.e. channels that change their conductance when a signal depolarizes or hyperpolarizes them). As a result, real dendrites can exhibit more complex behavior.. Still, the RC circuit model is often a reasonable approximation." Hence, we understand that this RC circuit is a big approximation of the neuronal behaviour.

Example Action Potential Plot

Neuron

The source of this image can be found at the following link: Image Source.

Scientific Background Influence on Algorithm

Based on what we learned during our research, we found that seizures will cause an increased frequency and magnitude of signal in the EEG output. Due to this, we considered three different methods of classifying data as a seizure or not. The first was an algorithm based on principle component analysis. The second utilized a simple signal magnitude comparision. The third considered only a range of frequencies and used the principle component analysis algorithm. Based on our research, these are three scientifically justified methods of classifying the data.

Concept Map

CONTACT

Suggestions? Potential Applications? Drop a note!

Olin College of Engineering, Needham MA
Email: sbansal, tjagielski (@olin.edu)